
Innovations at Northwestern
These innovations were brought about by collaborations between Northwestern Information Technology and various faculty partners around the University. Faculty, students, and staff from Weinberg, Medill, McCormick, and the School of Professional Studies have contributed to the innovations listed below.
If you have an idea for a future innovative learning analytic project or want to use any of the methods described below, please contact us.
Learn More About Northwestern's Innovative Experiments with Learning Analytics
Yellowdig Visualization Tool

Collaborators: Daniel Gruber (Medill), Northwestern Information Technology
Reach: Faculty and students using Yellowdig discussion boards
The Yellowdig Visualization tool provides an instructor and his/her students a useful way of visualizing class interactions in the Yellowdig Discussion Boards. The tool uses a network graph to distinctively display the students, their Yellowdig pins (new posts referring to externally published content), and comments made on those pins or on other comments. The graph displays people and pin images when provided, as well as the specific text used within the Yellowdig interactions. Sizes of nodes in the graph reflect the popularity of particular pins or comments.
This tool makes it easy to focus attention on particular subsets of the graph that are of interest to the student, by specifying both the type of ‘entity’ of interest, and also the time period in which the activity took place. The choice of entity can be made by directly interacting with the graph (e.g. clicking) or by selecting one or more entities listed in a right-hand side menu; while the choice of time period is determined by the state of a set of toggle buttons representing each week within a calendar term.
Students can choose to focus on entities such as people, pins and Yellowdig tags, while instructors can, in addition, focus on an additional set of entities computed by the tool via the application of natural language processing services to the text used in the interactions themselves (that is within pins, comments and even external articles).
Nebula: An Alternative Canvas Discussion Board Interface

Collaborators: William J. White and Seyed Iravani (McCormick Industrial Engineering and Management Sciences), IEMS PhD student, Jacqueline Ng, Northwestern Information Technology
Reach: Faculty and students using Canvas Discussion Boards
Nebula is an alternative interface to Canvas discussion forums created at Northwestern. It presents a visual representation of a Canvas discussion as an interactive network graph. A user can navigate through the network graph by hovering over nodes (which are created by a discussion post) to follow topics and classmates as they contribute in real time. The nodes themselves are color coded to show the user which conversations they have read and not yet read.
Nebula was created for instructors and TAs to help administer a course. By visualizing what was happening in the discussion forums, they are better informed on which topics are having the most impact and who amongst their students are leading the conversation.
One of the biggest benefits seen with Nebula's use is that typically when students are required to make a post for a grade on the discussion forums, they craft posts that are independent of their peer's posts. With Nebula, they are encouraged to not only start a thread, but also contribute to existing ones in a meaningful way. In classes with Nebula, posts have become shorter and more frequent. Instead of students writing a long thread on their point of view and not commenting on others, Nebula has facilitated better discussions that leads to a more fulfilling online course discussion experience.
Peer Review Experiment: Exploring Anonymity and Social Distance in Student Feedback

Collaborators: Bruce Ankenman and Seyed Iravani (McCormick Industrial Engineering and Management Sciences), IEMS PhD student, Jacqueline Ng, Northwestern Information Technology
Reach: Peer review classifier and sentiment analysis services and published results are available for Northwestern
Canvas supports peer grading, allowing students to review and assess classmates’ work. This offers students an opportunity to engage with the material in an evaluative way and reflect on what constitutes and conveys mastery. But how well does this work in practice? What can faculty do to frame the activity most effectively, especially when student may have little experience giving or receiving peer criticism and evaluation?
McCormick Professors Bruce Ankenman and Seyed Iravani (Industrial Engineering and Management Sciences) and IEMS PhD student, Jacqueline Ng conducted an experiment in a large, introductory level statistics course to explore these questions. They designed an experimental structure to explore effects of anonymous and non-anonymous peer assessment. As part of this experiment, analytics techniques for machine learning were used to train and identify three types of prominent review classifications:
- Judgmental Statement – short utterances of approval or disapproval .
- Detailed Elaboration – explanations acknowledging what has been done well or poorly .
- Constructive Criticism – substantive, supportive statements that provide critical suggestions for improvement.
Sentiment analysis was also performed to enrich available analytic metrics with tonal characteristics of anonymous and attributed reviews. Overall, their results indicate that female peer reviewers are more sensitive to anonymity. In contrast, no such changes in behavior are found among male peer reviewers.

Online / On-Campus: Analytics Perspective on Medill IMC Online and On-Campus Course Engagement and Outcomes

Collaborators: Tom Collinger (Medill), Northwestern Information Technology
Reach: Medill IMC Faculty and Administration ; Analysis methods may inform other course analysis
The Medill School of Journalism’s Integrated Marketing Communications graduate program serves a broad range of students in multiple course formats through its full-time, part-time, on-campus, and online programs. Available data from the same courses taught by the same faculty provided an opportunity to compare student engagement behaviors in Canvas against outcomes such as final grades and course evaluations. Highlighting both similarities and differences in on-campus and fully online courses provided useful insights as well as analysis methods that can be used in other analytics.
This project looked at language patterns (length, complex word usage, sentiment, reading level) in Canvas and Yellowdig discussion boards, activity and participation patterns (volume and first-usage) in Canvas, and use of online assignments.
Rewards Incentives: Leveraging Loyalty Rewards Programs to Incentivize MOOC Completion

Collaborators: William J. White and Seyed Iravani (McCormick Industrial Engineering and Management Sciences), IEMS PhD student, Jacqueline Ng, Northwestern Information Technology
Reach: Power Onboarding MOOC, Potential for Rewards and Messaging Experiments
Despite their potential to reach unprecedented numbers, one frequent observation regarding MOOCs are their relatively low completion rates among course participants.
In winter of 2016, McCormick Professors William J White and Seyed Iravani (Industrial Engineering and Management Sciences) and IEMS PhD student, Jacqueline Ng conducted a research experiment using a loyalty rewards program in Professor White’s Power Onboarding Coursera MOOC. In the experiment, learners received rewards, contingent on completing certain course milestones each week. The experiment offered direct rewards to learners purposefully, so that they were more inclined to view continued course engagement as a series of related decisions, and were thereby motivated to finish the course.
The experiment also tested the impact of reward timing on improving learner motivation and completion rates. Specifically, it assessed the efficacy of offering immediate versus delayed rewards, by varying whether learners receive their earned rewards at the end of each week, or upon completion of the course. Additionally, they were interested in analyzing the impact of expected versus unexpected rewards on learner engagement, persistence and overall completion rates.
The experimental design and its reward messaging was automated to achieve efficient operation at scale and for its potential adaptation and reuse in other similar MOOC or on-campus experiments.
Discussion Board Analytics: Student Use of Keywords and Named Entities

Collaborators: Jacqueline Wickham (School of Professional Studies), Northwestern Information Technology
Reach: Faculty using Canvas Discussion Boards
The Northwestern University School of Professional Studies offers a Master’s in Global Health in partnership with the Feinberg School of Medicine’s Center for Global Health. This fully online program explores health issues as manifested and addressed in various regions internationally including the roles of governmental and non-governmental organizations.
Being fully online, the use of discussion forums is an important channel for class engagement and learning. This analytics project used Natural Language Processing techniques to perform dictionary keyword extraction and Named Entity Recognition on a set of 5 400-level MSGH courses in the Fall of 2015. The goals of this effort were to:
- Use Natural Language Processing tools to identify discussion themes
- Develop student and faculty facing reports of discussion activity
- Use data reports on discussion participation to improve course design
A custom Canvas Discussion Analytics tool developed by Northwestern Information Technology was developed to perform keyword extraction for keywords, places, and people mentioned in the discussion as well as sentiment analysis and reading level analysis. The tool also collects statistics on participation by user and time.
The project report includes discussion forum analysis as well as temporal characteristics (time of day) and device usage.
Clickstream Analytics: Geographic, Temporal, and Platform Analysis of 5 SPS Courses

Collaborators: David Halsted (School of Professional Studies), Northwestern Information Technology
Reach: A tool based on this work is planned for general availability in Canvas Discussion Forums
Clickstream data analysis has been a driving force on the commercial Web for years, but we are at the beginning stages of learning how–and whether—this information can be useful in supporting and enhancing learning at the post-secondary level.
This project analyzed data from five courses in the SPS Masters Program in Global Health. MSGH students participate from all over the world and may access course materials at any time, day or night.
This project focused on three main areas:
- Geographical data–where are users?
- Device data–what devices (phones, tablets, laptops) do students use, and how?
- Temporal data–when do students do their work with DL courses?
The analysis was based on Canvas access. Network addresses and timestamps were used to identify the time and place of student access. The data set also contained information about the devices used to work with course materials and the resources students used; analysis of this data allowed us to see how students used different devices to accomplish different tasks within the courses.
A full description of the project and summary of its findings is available here: Data Analysis for Distance Learning Courses.
This project is part of the Experimental Teaching and Learning Analytics Workgroup.
Canvas Support Chatbot

Collaborators: Northwestern Information Technology, IBM Watson Assistant Team
Reach: Instructors, students, and staff using Canvas
The Canvas Support Chatbot is an automated chat tool created by Northwestern IT Teaching & Learning Technologies. It has been designed to answer some of the most frequently asked questions about Canvas at Northwestern. The chatbot specializes in enrollment-related inquiries, but it can also answer questions about other Northwestern-specific Canvas issues. Additionally, the Canvas Chatbot has the ability to search Instructure's Canvas Guides and provide links to the most relevant guides related to a user’s inquiry. If the chatbot cannot answer a question, it can create a ticket with the Northwestern IT Support Center and escalate a user’s inquiry to the appropriate team for further help.
The Canvas Support Chatbot was developed to provide an additional Canvas support option for Northwestern instructors, students, and staff seeking help with Canvas. Northwestern IT launched this project with initial guidance and support from the IBM Watson Assistant team.
Artificial intelligence (AI) is used in recognizing the user’s intent (their intention when speaking to the chatbot) as one of the intents the Canvas Chatbot has been trained on. Conversational AI services (including machine learning classification, plus limited natural language understanding) are provided by IBM Watson Assistant. The Canvas Chatbot automatically learns from user feedback provided about search results (by dynamically training itself via APIs).
Northwestern IT is using Dashbot to track anonymized user data and gain insight through analytics related to user engagement; user retention; helpful and unhelpful responses by the chatbot; and instances of escalation to the support team. This data will be used to improve the Canvas Chatbot.
Opportunities
Stories Posted in Innovations at Northwestern

Enabling Hybrid Teaching and Learning Opportunities
Learn More
Preparing for New and Expanded Possibilities
More
Wednesday, 7 April 2021 - 4:18pm
Thursday, 8 April 2021 - 2:08pm

New digital collection interface makes browsing archives easy
Learn More
Visit digitalcollections.library.northwestern
More
Tuesday, 21 May 2019 - 2:14pm
Friday, 24 May 2019 - 11:55am

Natural Language Processing, Part Two: Advanced Applications
Learn More
Advanced techniques
More
Wednesday, 1 May 2019 - 3:00am
Wednesday, 1 May 2019 - 3:01am
Need More Storage Space in Your Canvas Course?
Learn More
Ask Canvas Support Chatbot for Help
More
Wednesday, 10 April 2019 - 8:54am
Thursday, 30 May 2019 - 1:43pm

How Superheroes Can Save Online Discussions
Learn More
Discussion Hero
More
Tuesday, 19 February 2019 - 3:00am
Tuesday, 19 February 2019 - 3:01am

Northwestern Digital Learning Podcast: Episode 11, Exploring AR and VR
Learn More
Delving into Immersive Reality with the Knight Lab
More
Tuesday, 5 February 2019 - 4:00am
Tuesday, 4 June 2019 - 3:26pm
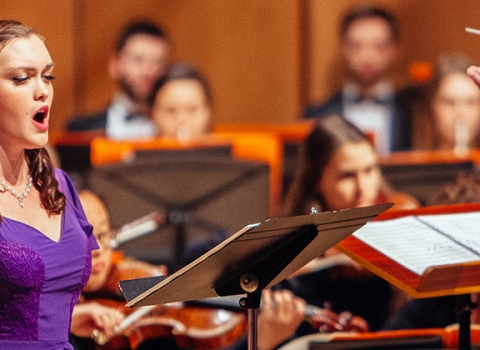
Northwestern Digital Learning Podcast: Episode 10, Singer Savvy
Learn More
A "Fitbit" for your vocal cords
More
Tuesday, 15 January 2019 - 3:00am
Friday, 8 February 2019 - 3:29pm

GradeSync Now Available in All Canvas Courses
Learn More
Seamlessly send grades to CAESAR
More
Monday, 7 May 2018 - 9:09am
Thursday, 28 October 2021 - 9:13am

Northwestern Digital Learning Podcast: Episode 7, Smellovision
Learn More
Creating a smell virtual landscape
More
Monday, 30 April 2018 - 3:00am
Tuesday, 30 October 2018 - 2:59pm
Knight Lab Studio Class Offers Innovative, Real-World Experiences
Learn More
Lo-fi solutions to high-test problems
More
Monday, 2 April 2018 - 3:00am
Monday, 2 April 2018 - 3:14pm
MSLOC Expands Use of Digital Portfolios
Learn More
Building Muscle and Inspiring Reflection
More
Thursday, 15 March 2018 - 2:00am
Monday, 7 May 2018 - 10:02am
Submitting final grades from Canvas is a few clicks away
Learn More
GradeSync connects Canvas and CAESAR
More
Monday, 5 March 2018 - 9:02am
Friday, 28 February 2020 - 12:32pm
- 1 of 3
- ››